Four quick daily Google Analytics checks
Here are four quick daily Google Analytics checks courtesy of Senior SEO Manager Jack Stonehouse.
Google Analytics is a free service offered by Google that provides insights and data for your website traffic. It has a vast amount of useful information that you can use to ensure your business is on track. It can however be quite overwhelming when you log in there are hundreds if not thousands of reports you can view and create.
Below are a handful of quick and simple checks you can do for your website. I prefer to change my date view to show the last 30 days or so, this gives me a better trend across the month. I will also review all the reports compared to the previous 30 days and the same period last year. Comparing year on year will help identify any seasonal trends.
What we are looking out for is any major change that isn’t in line with the normal trend.
1. Channels
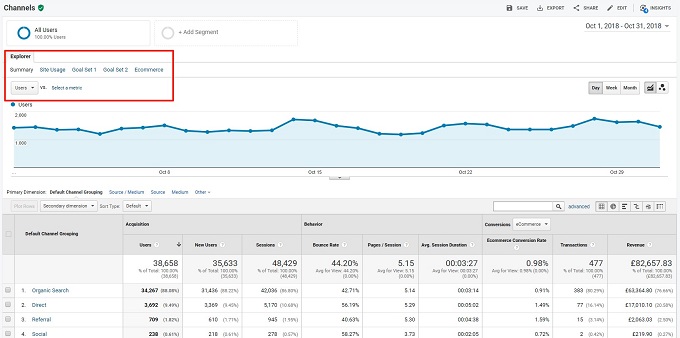
The channels report is found by going to Acquisition > All Traffic > Channels. This report covers the main mediums that send you traffic. The key channels are:
- Organic Search – This is all traffic from Search Engines (Google, Bing, Duck Duck Go etc.)
- Paid Search – This is traffic from PPC ads such as Google Adwords
- Direct – This is traffic that comes from users that type your website domain name straight into the browser, it is also a catch-all for traffic that Google cannot identify and is just placed in the Direct bucket
- Social – This is traffic from social networks such as Facebook, Twitter and Pinterest
- Referral – This is traffic to your website from other websites
- Email – This is traffic from Email campaigns
The key stats to check on the channel report are Users, Sessions, Bounce Rate, Conversion Rate and Revenue/Goals (Revenue for E-commerce websites and Goals for all other sites).

You can change the data that is displayed on the graph by using the menu/drop down highlighted red in the screenshot above.
2. Referrals
The referrals report is found by going to Acquisition > All Traffic > Referrals. This report shows traffic to your website from other websites.
This check is just a quick one to see if there are any new websites that are driving traffic to your site. If there are you could potentially contact them to see how you could both work together to increase the traffic further. This could be through providing them content with another link back to your website, or if have an affiliate system setup, you could ask them to sign up.
3. Landing Pages
The landing pages report is found by going to Behaviour > Site Content > Landing Pages. This report shows which pages users land on when they first come to your website.
This is important to monitor for any vast changes in visits, some common situations for an increase in landing page traffic are if a social post goes viral, you get a good backlink that is driving traffic or a key term starts ranking in a high up position in the Search Engine Results Pages.

4. Ecommerce Overview
The ecommerce overview report is found by going to Conversions > Ecommerce >Overview. This report is just for sites that sell products and shows key information such as revenue and conversion rate.
You need to enable this report by adding ecommerce tracking to your website, it is also recommended you add enhanced ecommerce tracking so you get even more in-depth data to review.
Key stats to watch here are any drop in revenue or conversion rate, some reasons could be due to an item going out of stock or an issue with the checkout process.
For more detailed statistics you can also view the following e-commerce reports (once you have enabled enhanced tracking):
- Shopping Behaviour
- Checkout Behaviour
- Product Performance
- Sale Performance
If you have any questions then please leave a comment below or get in touch with our friendly team here.

